GRANULARITIES = ['daily','60min','15min','1min']
定义常量
第二步:最近24小时的负载统计
接下来,我们将回顾过去24小时内每种加密货币的基本统计数据。我们还将添加一个自定义列“表现”,它将显示报表期间从开始到结束的表现。代码的其余部分负责数字格式化。
currency_rows = []

for currency in MY_CRYPTO_CURRENCIES:

 data = public_client.get_product_24hr_stats(currency+'-'+MY_BASE_CURRENCY)

 currency_rows.append(data)

df_24hstats = pd.DataFrame(currency_rows, index = MY_CRYPTO_CURRENCIES)

df_24hstats['currency'] = df_24hstats.index

df_24hstats['open'] = df_24hstats['open'].astype(float)

df_24hstats['high'] = df_24hstats['high'].astype(float)

df_24hstats['low'] = df_24hstats['low'].astype(float)

df_24hstats['volume'] = df_24hstats['volume'].astype(float)

df_24hstats['last'] = df_24hstats['last'].astype(float)

df_24hstats['volume_30day'] = df_24hstats['volume_30day'].astype(float)

df_24hstats['performance'] = ((df_24hstats['last']-df_24hstats['open']) / df_24hstats['open']) * 100

df_24hstats_formatted = df_24hstats.copy()

df_24hstats_formatted['performance'] = df_24hstats_formatted['performance'].apply(lambda x: "{:.2f}%".format((x)))

df_24hstats_formatted['open'] = df_24hstats_formatted['open'].apply(lambda x: "{:,.2f}€".format((x)))

df_24hstats_formatted['high'] = df_24hstats_formatted['high'].apply(lambda x: "{:,.2f}€".format((x)))

df_24hstats_formatted['low'] = df_24hstats_formatted['low'].apply(lambda x: "{:,.2f}€".format((x)))

df_24hstats_formatted['last'] = df_24hstats_formatted['last'].apply(lambda x: "{:,.2f}€".format((x)))
df_24hstats_formatted.style.hide_columns(['volume','volume_30day'])
从
24小时加密货币数据和表现
第三步:加载不同粒度的历史数据
接下来,我们将使用不同的时间片粒度下载历史市场数据。因此,我们需要像步骤2那样遍历所有货币。下面是如何检索每日数据的例子:
currency_history_rows = []

for currency in MY_CRYPTO_CURRENCIES:

 start_date = (server_time_now - timedelta(days=90)).isoformat()

 end_date = server_time_now.isoformat()

 data = public_client.get_product_historic_rates(currency+'-'+MY_BASE_CURRENCY, start=start_date, end=end_date, granularity=86400)

 [x.append(currency) for x in data]

 [x.append('daily') for x in data]

 currency_history_rows.extend(data)

df_history = pd.DataFrame(currency_history_rows)

df_history.columns = ['time','low','high','open','close','volume','currency','granularity']
df_history['date'] = pd.to_datetime(df_history['time'], unit='s')
为了检索时间片数据,我们需要以下信息:
所需时间段的ISO格式开始日期
所需时间段的ISO格式结束日期
以秒为单位的粒度(在本例中为86400秒,等于24小时)
如果你想获得过去300小时的每小时数据,可以执行以下操作:
start_date = (server_time_now - timedelta(hours=300)).isoformat()

end_date = server_time_now.isoformat()
data = public_client.get_product_historic_rates(currency+'-'+MY_BASE_CURRENCY, start=start_date, end=end_date, granularity=3600)
现在我们的Pandas数据框如下(为了更好的可读性,增加了一些额外的列,如年、月、日):

带有每日时间片的加密货币历史市场数据
第四步:添加指标
现在是最具挑战性的部分。我们想在我们的数据中添加一些自定义的投资指标。这将增强我们从简单的市场数据中获得的信息。我们将添加以下信息:
SMA3和SMA7(过去3和7个时间片的简单移动平均线):这是一个基于价格的、滞后的(或反应性的)指标,显示某一段时间内某一证券的平均价格。在解释图表时,移动平均线消除了“噪音”。噪音是由价格和音量的波动构成的。简单移动平均线是一种未加权移动平均线。这意味着数据集中的每个时间段都具有同等的重要性,并且具有同等的权重。
EMA12和EMA26(过去12和26个时间片上的指数移动平均线):EMA 的滞后比 SMA 少得多,因为它更重视最近的价格。因此,它的旋转速度比SMA快。我们可以选择不同的时间片,但是12和26是常用的持续时间,我们将在示例中使用它们。
MACD(移动平均收敛/背离):一个很好的指标来确定任何证券的总体趋势。它需要短期 EMA 和长期 EMA 之间的差。正的 MACD 值是一个积极的市场趋势的指标。负的 MACD 值是负面市场趋势的指标。
MACD信号:MACD信号线是MACD线的特定时间片组上的 EMA。通常,该值设置为9个时间片。
MACD柱:这是MACD线和MACD信号线之间的区别。当 MACD 线在 MACD 信号线上方交叉时,就会出现看涨交叉。当 MACD 线在 MACD 信号线下方交叉时,就会出现看跌交叉。稍后,当我们将数据可视化时,就将确切地看到这意味着什么。
从开盘到收盘的表现:对于每一个时间片,特定时期的收盘价和开盘价之间的差异以百分比表示。
高低跨度:在一个时期内最高价格和最低价格之间的百分比偏差。这显示了一个时间片内的波动。
最近3个时期的绝对表现:该指标将最近3个时间片的表现作为一个绝对值(用我们在常数中定义的选择的基础货币度量)。
最近3个时间段的表现百分比:该指标以相对值(百分比)的形式提供最近3个时间片的表现。
牛或熊:如果MACD直方图为正,就写“牛”;如果MACD直方图为负,就写“熊”。
持续的市场趋势:为了识别从牛市到熊市的转变,反之亦然,如果从前一个时间片的趋势继续,这一栏为“True”,如果趋势发生了变化,则为“False”。
多亏了Panda强大的向量运算和内置函数,我们只用了几行代码就实现了这一点。
currency_history_rows_enhanced = []

for currency in MY_CRYPTO_CURRENCIES:

 for granularity in GRANULARITIES:

 df_history_currency = df_history.query('granularity == @granularity & currency == @currency').copy()

 df_history_currency = df_history_currency.sort_values(['date'], ascending=True)

 df_history_currency['SMA3'] = df_history_currency['close'].rolling(window=3).mean()

 df_history_currency['SMA7'] = df_history_currency['close'].rolling(window=7).mean()

 df_history_currency['EMA12'] = df_history_currency['close'].ewm(span=12, adjust=False).mean()

 df_history_currency['EMA26'] = df_history_currency['close'].ewm(span=26, adjust=False).mean()

 df_history_currency['MACD'] = df_history_currency['EMA12'] - df_history_currency['EMA26']

 df_history_currency['MACD_signal'] = df_history_currency['MACD'].ewm(span=9, adjust=False).mean()

 df_history_currency['macd_histogram'] = ((df_history_currency['MACD']-df_history_currency['MACD_signal']))

 df_history_currency['open_to_close_perf'] = ((df_history_currency['close']-df_history_currency['open']) / df_history_currency['open'])

 df_history_currency['high_low_span'] = ((df_history_currency['high']-df_history_currency['low']) / df_history_currency['high'])

 df_history_currency['open_perf_last_3_period_abs'] = df_history_currency['open'].rolling(window=4).apply(lambda x: x.iloc[1] - x.iloc[0])

 df_history_currency['open_perf_last_3_period_per'] = df_history_currency['open'].rolling(window=4).apply(lambda x: (x.iloc[1] - x.iloc[0])/x.iloc[0])

 df_history_currency['bull_bear'] = np.where(df_history_currency['macd_histogram']< 0, 'Bear', 'Bull')

 currency_history_rows_enhanced.append(df_history_currency)

df_history_enhanced = pd.concat(currency_history_rows_enhanced, ignore_index=True)

df_history_enhanced = df_history_enhanced.sort_values(['currency','granularity','date'], ascending=True)
df_history_enhanced['market_trend_continued'] = df_history_enhanced.bull_bear.eq(df_history_enhanced.bull_bear.shift()) & df_history_enhanced.currency.eq(df_history_enhanced.currency.shift()) & df_history_enhanced.granularity.eq(df_history_enhanced.granularity.shift())
第五步:利用信息进行决策
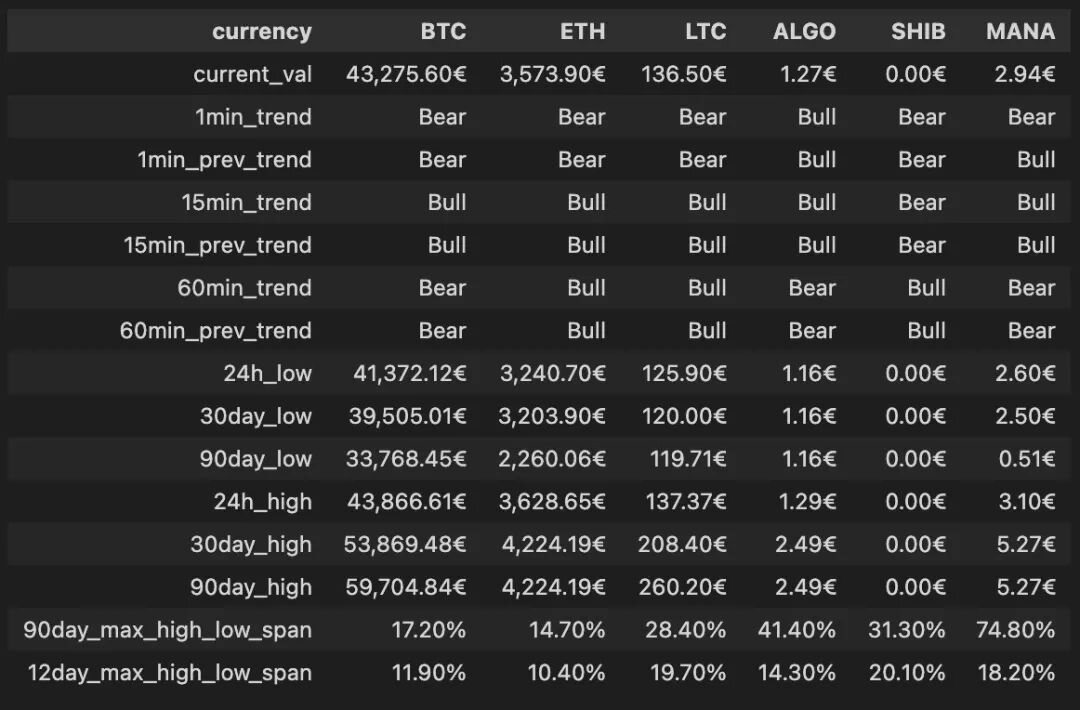
现在我们已经为进一步的分析创建了良好的基础,我们可以利用这些信息并创建一个定制的Pandas数据框。它保存了我们选择的加密货币的一些基本表现信息:

过去90天内各种加密货币的表现
第六步:可视化加密市场数据
在最后一步中,我们希望可视化到目前为止构建的基础数据。为了可视化,我们将使用强大的Plotly库。
在我们能够可视化数据之前,我们需要再创建一个Pandas数据框,它将包含绘制下图中看跌(红色)和看涨(绿色)框所需的信息。因此,我们需要构建一个表,它将给出牛市和熊市的时间周期,包括开始和结束的时间周期。多亏了Pandas,我们可以通过以下代码片段轻松实现这一点:
market_trend_interval_rows = []

for currency in MY_CRYPTO_CURRENCIES:

 for granularity in GRANULARITIES:

 df_history_market_trend_intervals = df_history_enhanced.query('currency == @currency and market_trend_continued == False and granularity == @granularity').copy()

 df_history_market_trend_intervals['next_period_date'] = df_history_market_trend_intervals.date.shift(-1)

 df_history_market_trend_intervals['next_period_date'] = df_history_market_trend_intervals['next_period_date']

 df_history_market_trend_intervals.next_period_date = df_history_market_trend_intervals.next_period_date.fillna(datetime.now())

 df_history_market_trend_intervals['color'] = df_history_market_trend_intervals['bull_bear'].apply(lambda x: GREEN_COLOR if x == 'Bull' else RED_COLOR)

 df_history_market_trend_intervals = df_history_market_trend_intervals[['currency','granularity','bull_bear','color','date','next_period_date']].rename(columns={"date": "start_date", "next_period_date": "finish_date"})

 market_trend_interval_rows.append(df_history_market_trend_intervals)
df_history_market_trend_intervals = pd.concat(market_trend_interval_rows, ignore_index=True)
强大的 Pandas 功能来改变我们的时间片
这段代码将给我们一个Pandas数据框,如下所示:

压缩看涨和看跌时间段的 Pandas 数据框
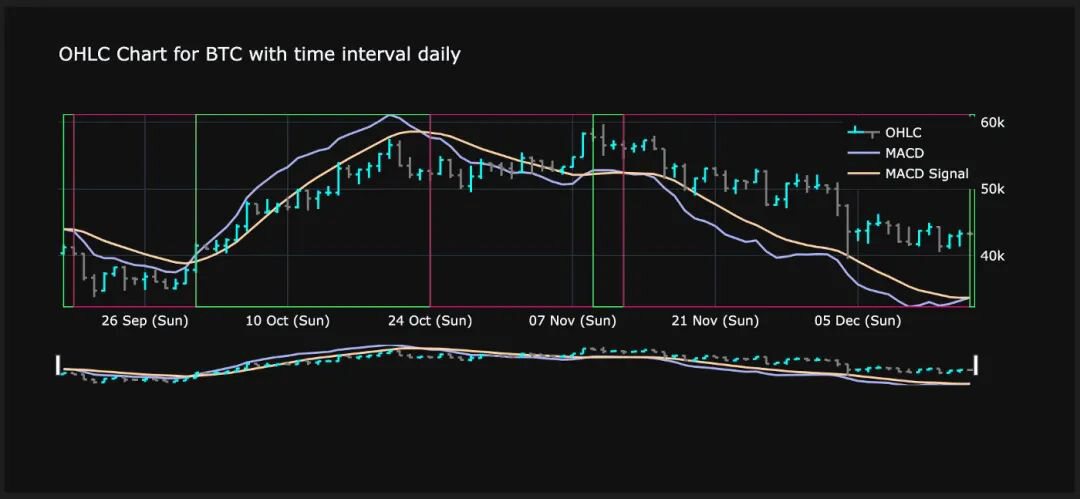
关于Plotly代码,可以在Jupyter Notebook中操作。Plotly的输出如下所示:

复杂的加密货币蜡烛图,包括性能指标和市场趋势
这个图表使用了Plotly中的两个y轴。右边的y轴是用来绘制蜡烛图的。左边的y轴用于绘制MACD和MACD信号线。
每当MACD线越过MACD信号线上方时,我们就进入一个牛市周期,这个周期用绿色方框表示。每当MACD线跌破MACD信号线,我们就进入熊市周期。后一种情况用一个红框表示。
小结
到目前为止,我们已经学习了如何利用