
本文将使用docker搭建普罗米修斯可视化监控环境,安装组件包括:Influx、Prometheus、Grafana,并基于该环境进行Substrate节点可视化监控。
jasonruan 2020.08.07
[TOC]
1 前言
本文将使用docker搭建普罗米修斯可视化监控环境,安装组件包括:Influx、Prometheus、Grafana,并基于该环境进行Substrate节点可视化监控。
2 操作步骤
2.1 Promethues配置
# prometheus.yml global: scrape_interval: 15s evaluation_interval: 15s scrape_configs: - job_name: 'prometheus' static_configs: - targets: ['localhost:9090'] - job_name: 'js_substrate_node' scrape_interval: 5s static_configs: - targets: ['119.28.233.229:9615'] remote_write: - url: "http://influxdb:8086/api/v1/prom/write?db=prometheus" remote_read: - url: "http://influxdb:8086/api/v1/prom/read?db=prometheus"2.2 Grafana配置
2.2.1 配置修改
主要是修改
[database]栏位,其他配置按需修改
# grafana.ini [database] type = mysql host = 172.29.0.1:33306 name = grafana user = jason password = ruan url =2.2.2 账号创建
mysql> CREATE DATABASE grafana DEFAULT CHARACTER SET utf8mb4; mysql> CREATE USER 'jason'@'%' IDENTIFIED BY 'ruan'; mysql> GRANT all privileges ON grafana.* TO 'jason'@'%'; mysql> FLUSH PRIVILEGES;2.3 Docker构建脚本
# docker-compose.yml version: '2' services: prometheus: image: prom/prometheus:v2.20.1 hostname: prometheus container_name: prom volumes: - /usr/share/zoneinfo/Asia/Shanghai:/etc/localtime:ro - ./prometheus.yml:/etc/prometheus/prometheus.yml - prometheus_data:/prometheus command: - '--web.enable-lifecycle' - '--config.file=/etc/prometheus/prometheus.yml' ports: - '9090:9090' networks: prometheus: aliases: - prometheus ipv4_address: 172.29.0.2 logging: driver: json-file options: max-file: '3' max-size: 100m grafana: image: grafana/grafana:7.1.2 hostname: grafana container_name: grafana volumes: - /usr/share/zoneinfo/Asia/Shanghai:/etc/localtime:ro - grafana_data:/var/lib/grafana environment: - GF_SECURITY_ADMIN_PASSWORD=ruan depends_on: - prometheus ports: - '3000:3000' networks: prometheus: aliases: - grafana ipv4_address: 172.29.0.3 logging: driver: json-file options: max-file: '3' max-size: 100m influxdb: image: influxdb:1.8.1 hostname: influxdb container_name: influxdb volumes: - /usr/share/zoneinfo/Asia/Shanghai:/etc/localtime:ro - influxdb_data:/influxdb ports: - '8083:8083' - '8086:8086' - '8090:8090' networks: prometheus: aliases: - influxdb ipv4_address: 172.29.0.4 logging: driver: json-file options: max-file: '3' max-size: 100m networks: prometheus: driver: bridge ipam: config: - subnet: 172.29.0.0/16 volumes: grafana_data: {} prometheus_data: {} influxdb_data: {}2.4 组件启动
$ docker-compose -f docker-compose.yml up -d Starting prom ... Starting prom Starting influxdb ... Starting prom ... done Starting grafana ... Starting grafana ... done2.5 Influx配置
2.5.1 创建账号
[jason@RUAN:~]$ influx Visit https://enterprise.influxdata.com to register for updates, InfluxDB server management, and monitoring. Connected to http://localhost:8086 version 1.8.1 InfluxDB shell version: 1.1.1 > CREATE USER jason WITH PASSWORD 'ruan' WITH ALL PRIVILEGES; > show users; user admin ---- ----- jason true2.5.2 创建数据库
> CREATE DATABASE prometheus; > > SHOW DATABASES; name: databases name ---- _internal prometheus2.5.3 查看表
> use prometheus; Using database prometheus > > show measurements; > > insert test,host=127.0.0.1,monitor_name=test count=1 > > show measurements; name: measurements name ---- go_gc_duration_seconds go_gc_duration_seconds_count go_gc_duration_seconds_sum go_goroutines go_info go_memstats_alloc_bytes go_memstats_alloc_bytes_total go_memstats_buck_hash_sys_bytes go_memstats_frees_total go_memstats_gc_cpu_fraction go_memstats_gc_sys_bytes go_memstats_heap_alloc_bytes go_memstats_heap_idle_bytes ......2.6 监控界面
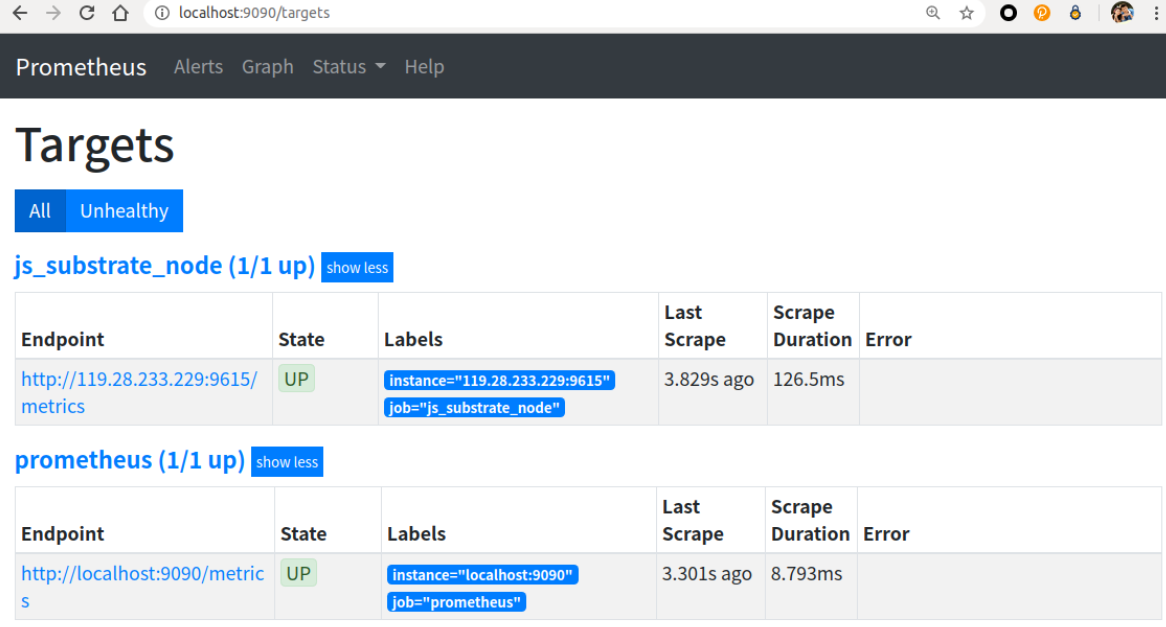
查看普罗米修斯控制台,看看服务启动是否正常。
2.6.1 Prometheus管理页面
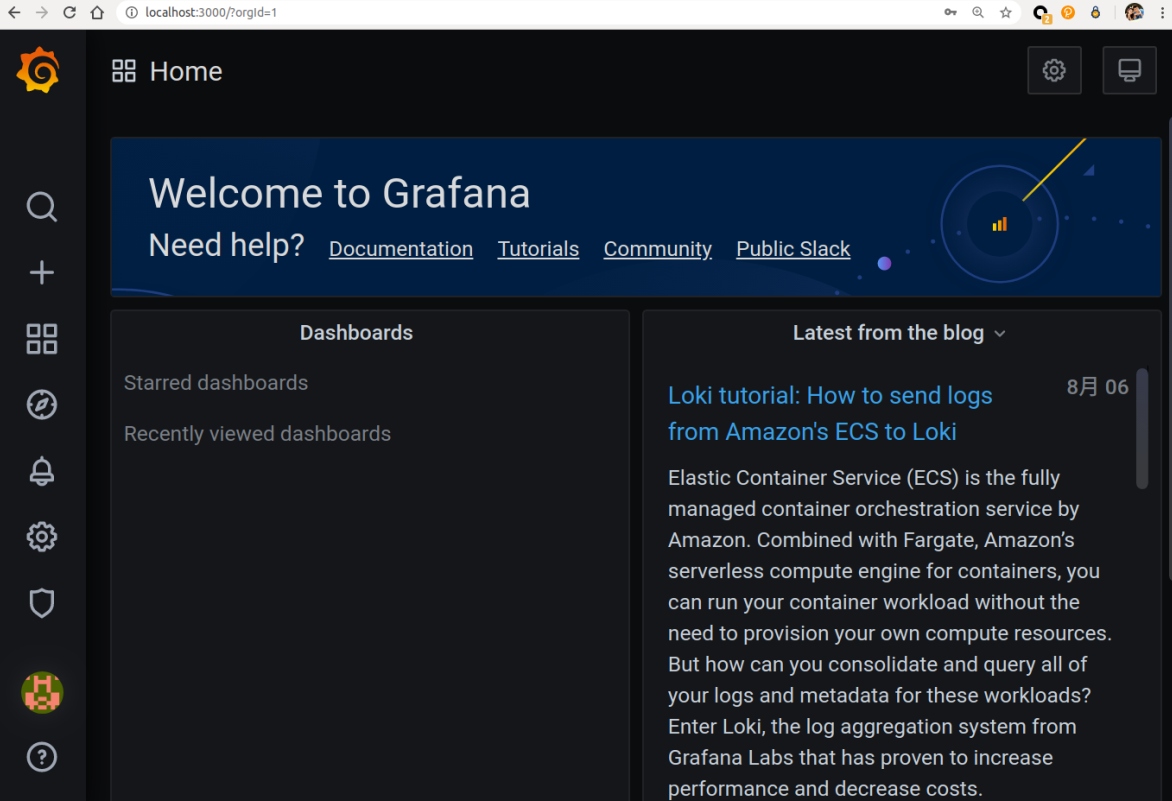
2.6.2 Grafana管理页面
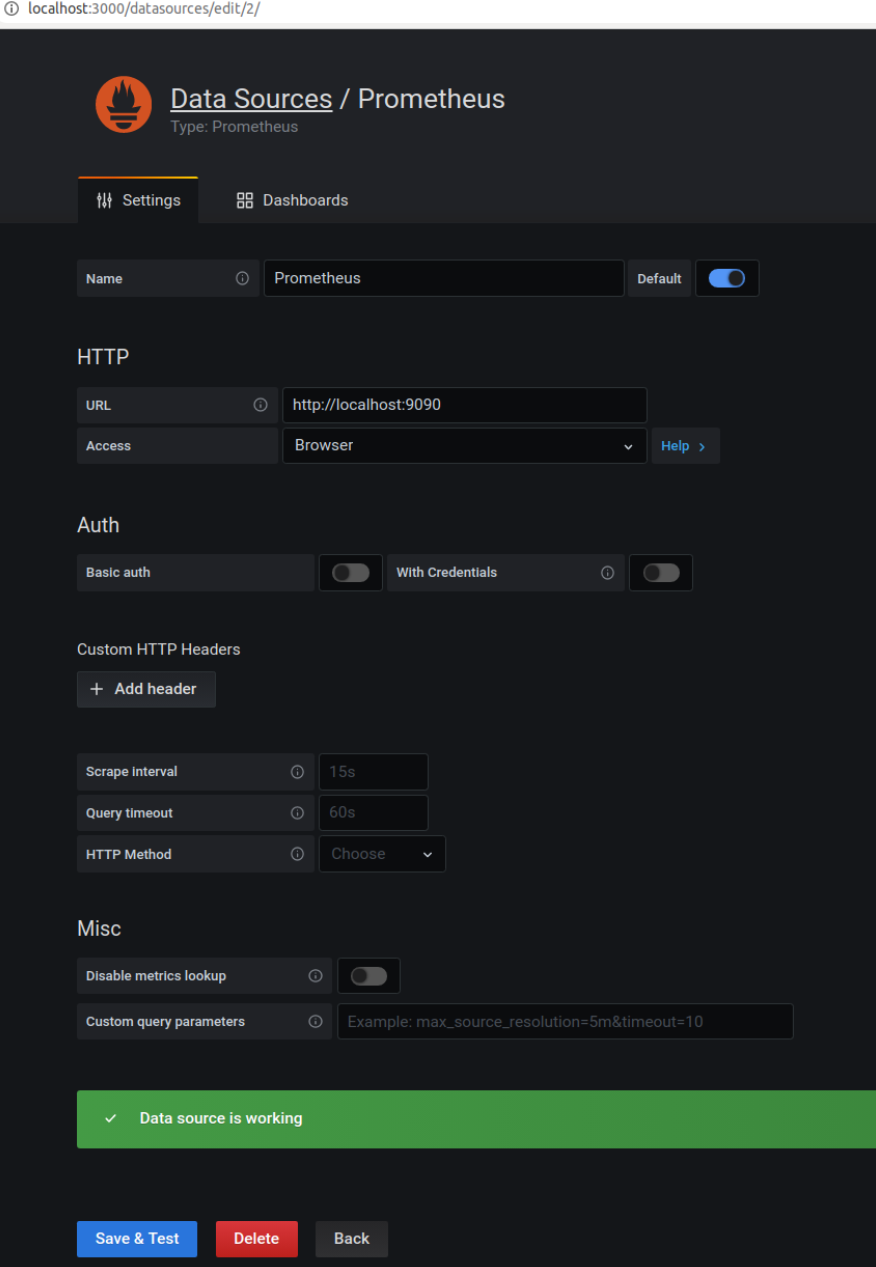
2.7 添加数据源
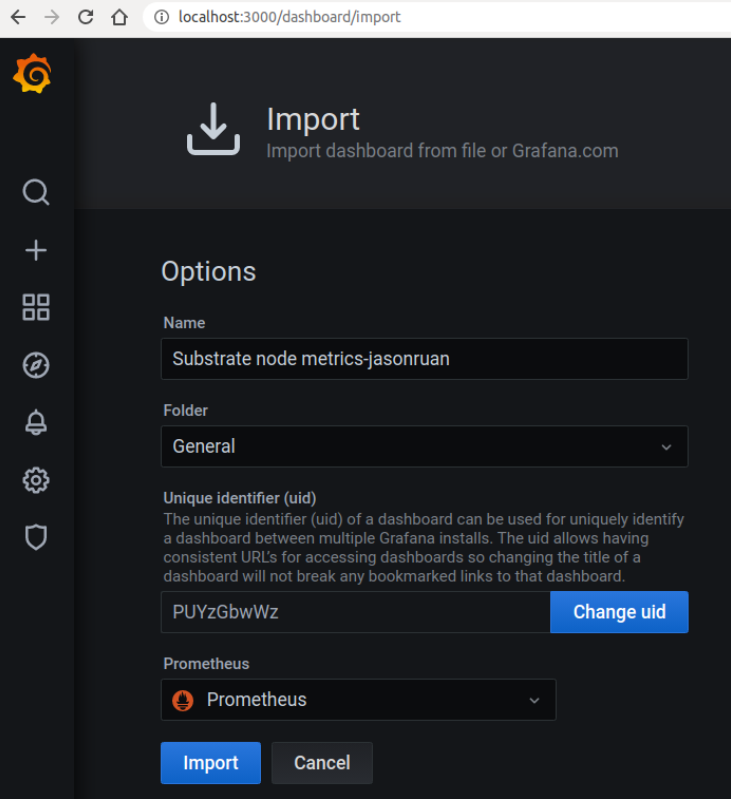
2.8 导入仪表盘
下载并导入Substrate node metrics仪表盘
https://grafana.com/grafana/dashboards/11784
2.9 Substrate节点启动
2.9.1 节点1
[Jason@RUAN:~/Blockchain/substrate-node-template] (v2.0.0-rc5)$ ./target/release/node-template --ws-external --rpc-external --rpc-cors=all --prometheus-external --alice --chain local --base-path /tmp/alice 2020-08-07 12:27:52 Substrate Node 2020-08-07 12:27:52 ✌️ version 2.0.0-rc5-8f769db-x86_64-linux-gnu 2020-08-07 12:27:52 ❤️ by Substrate DevHub <https://github.com/substrate-developer-hub>, 2017-2020 2020-08-07 12:27:52 📋 Chain specification: Local Testnet 2020-08-07 12:27:52 🏷 Node name: Alice 2020-08-07 12:27:52 👤 Role: AUTHORITY 2020-08-07 12:27:52 💾 Database: RocksDb at /tmp/alice/chains/local_testnet/db 2020-08-07 12:27:52 ⛓ Native runtime: node-template-1 (node-template-1.tx1.au1) 2020-08-07 12:27:52 🔨 Initializing Genesis block/state (state: 0xd3e7…c7c0, header-hash: 0x5094…9695) 2020-08-07 12:27:52 👴 Loading GRANDPA authority set from genesis on what appears to be first startup. 2020-08-07 12:27:52 ⏱ Loaded block-time = 6000 milliseconds from genesis on first-launch 2020-08-07 12:27:52 📦 Highest known block at #0 2020-08-07 12:27:52 Using default protocol ID "sup" because none is configured in the chain specs 2020-08-07 12:27:52 🏷 Local node identity is: 12D3KooWJLpUqkMJ4RtvRybiB5g3C9qNj6JgGS8ZGoDSGLUCf4su (legacy representation: QmNYMqDvP4axrdvE62dfSfdfGE6baSFMjxJQRh2xpKgQrb) 2020-08-07 12:27:52 〽 Prometheus server started at 0.0.0.0:9615 2020-08-07 12:27:57 💤 Idle (0 peers), best: #0 (0x5094…9695), finalized #0 (0x5094…9695), ⬇ 0 ⬆ 0 2020-08-07 12:28:02 💤 Idle (0 peers), best: #0 (0x5094…9695), finalized #0 (0x5094…9695), ⬇ 0 ⬆ 0 2020-08-07 12:28:04 🔍 Discovered new external address for our node: /ip4/172.29.0.6/tcp/30333/p2p/12D3KooWJLpUqkMJ4RtvRybiB5g3C9qNj6JgGS8ZGoDSGLUCf4su 2020-08-07 12:28:06 ✨ Imported #1 (0xf0d7…f842) 2020-08-07 12:28:07 💤 Idle (1 peers), best: #1 (0xf0d7…f842), finalized #0 (0x5094…9695), ⬇ 1.0kiB/s ⬆ 1.0kiB/s 2020-08-07 12:28:12 🙌 Starting consensus session on top of parent 0xf0d750e7097f1e9e26f26f111de073f4ff098d81f37147b5ab9cee253742f842 2020-08-07 12:28:12 🎁 Prepared block for proposing at 2 [hash: 0x688f9ff1c73b9dd9272c2fcbaee1abf95814e519d8a4e62c22fb84df1b731d6f; parent_hash: 0xf0d7…f842; extrinsics (1): [0x389b…e374]] 2020-08-07 12:28:12 🔖 Pre-sealed block for proposal at 2. Hash now 0x66327cc4e5809e8acb0fb7bb7ff0210057d94bfb69d53c00d66b97ffa876ef34, previously 0x688f9ff1c73b9dd9272c2fcbaee1abf95814e519d8a4e62c22fb84df1b731d6f. 2020-08-07 12:28:12 ✨ Imported #2 (0x6632…ef34) 2020-08-07 12:28:12 💤 Idle (1 peers), best: #2 (0x6632…ef34), finalized #0 (0x5094…9695), ⬇ 0.7kiB/s ⬆ 0.7kiB/s 2020-08-07 12:28:17 💤 Idle (1 peers), best: #2 (0x6632…ef34), finalized #0 (0x5094…9695), ⬇ 0.6kiB/s ⬆ 0.6kiB/s 2020-08-07 12:28:18 ✨ Imported #3 (0x8787…9ed6) 2020-08-07 12:28:22 💤 Idle (1 peers), best: #3 (0x8787…9ed6), finalized #1 (0xf0d7…f842), ⬇ 1.0kiB/s ⬆ 1.0kiB/s 2020-08-07 12:28:24 🙌 Starting consensus session on top of parent 0x878796e04d7bf0337921dd3b50c8cafec808202735859e3b92fc75d5df5c9ed6 2020-08-07 12:28:24 🎁 Prepared block for proposing at 4 [hash: 0x86f349f055d3f280441abb63a257525bdfedeb0d60af4fb845d30d600a05e2f0; parent_hash: 0x8787…9ed6; extrinsics (1): [0x844f…8604]] 2020-08-07 12:28:24 🔖 Pre-sealed block for proposal at 4. Hash now 0xdf761d134e10543ee1d92452ca7e63b23f21b690619c8602c76cc29e596b3ebf, previously 0x86f349f055d3f280441abb63a257525bdfedeb0d60af4fb845d30d600a05e2f0. 2020-08-07 12:28:24 ✨ Imported #4 (0xdf76…3ebf)2.9.2 节点2
[Jason@RUAN:~/Blockchain/substrate-node-template] (v2.0.0-rc5)$ ./target/release/node-template --ws-external --rpc-external --rpc-cors=all --prometheus-external --bob --chain local --base-path /tmp/bob 2020-08-07 12:28:03 Substrate Node 2020-08-07 12:28:03 ✌️ version 2.0.0-rc5-8f769db-x86_64-linux-gnu 2020-08-07 12:28:03 ❤️ by Substrate DevHub <https://github.com/substrate-developer-hub>, 2017-2020 2020-08-07 12:28:03 📋 Chain specification: Local Testnet 2020-08-07 12:28:03 🏷 Node name: Bob 2020-08-07 12:28:03 👤 Role: AUTHORITY 2020-08-07 12:28:03 💾 Database: RocksDb at /tmp/bob/chains/local_testnet/db 2020-08-07 12:28:03 ⛓ Native runtime: node-template-1 (node-template-1.tx1.au1) 2020-08-07 12:28:03 🔨 Initializing Genesis block/state (state: 0xd3e7…c7c0, header-hash: 0x5094…9695) 2020-08-07 12:28:03 👴 Loading GRANDPA authority set from genesis on what appears to be first startup. 2020-08-07 12:28:03 ⏱ Loaded block-time = 6000 milliseconds from genesis on first-launch 2020-08-07 12:28:03 📦 Highest known block at #0 2020-08-07 12:28:03 Using default protocol ID "sup" because none is configured in the chain specs 2020-08-07 12:28:03 🏷 Local node identity is: 12D3KooWDg7tvBQBeh7zDbE2iyBEvayvrHYD86RY3Lzpgw1GCNqt (legacy representation: Qma2zuosCBQNEKJX45rtYtCp9MZkRvdRduK917xJKUkBup) 2020-08-07 12:28:03 📪 Libp2p listener () closed: Address already in use (os error 98) 2020-08-07 12:28:03 📪 Libp2p listener () closed: Address already in use (os error 98) 2020-08-07 12:28:03 Unable to bind RPC server to 0.0.0.0:9944. Trying random port. 2020-08-07 12:28:06 🙌 Starting consensus session on top of parent 0x5094621351e16d3b1541767e587a3349e8eaf1f4b3a1115e232d2a12661e9695 2020-08-07 12:28:06 🎁 Prepared block for proposing at 1 [hash: 0x771282626214db570c4597c1e16ad86ab97cb1147e44325ab08d240490c89c24; parent_hash: 0x5094…9695; extrinsics (1): [0x2d75…53e2]] 2020-08-07 12:28:06 🔖 Pre-sealed block for proposal at 1. Hash now 0xf0d750e7097f1e9e26f26f111de073f4ff098d81f37147b5ab9cee253742f842, previously 0x771282626214db570c4597c1e16ad86ab97cb1147e44325ab08d240490c89c24. 2020-08-07 12:28:06 ✨ Imported #1 (0xf0d7…f842) 2020-08-07 12:28:08 💤 Idle (1 peers), best: #1 (0xf0d7…f842), finalized #0 (0x5094…9695), ⬇ 1.2kiB/s ⬆ 1.2kiB/s 2020-08-07 12:28:12 ✨ Imported #2 (0x6632…ef34) 2020-08-07 12:28:13 💤 Idle (1 peers), best: #2 (0x6632…ef34), finalized #0 (0x5094…9695), ⬇ 0.7kiB/s ⬆ 0.7kiB/s 2020-08-07 12:28:18 🙌 Starting consensus session on top of parent 0x66327cc4e5809e8acb0fb7bb7ff0210057d94bfb69d53c00d66b97ffa876ef34 2020-08-07 12:28:18 🎁 Prepared block for proposing at 3 [hash: 0xfdf55a8d3975da5a57e6ab7ba66c97d6ac26099af465ec6a58a9c2150438e1ec; parent_hash: 0x6632…ef34; extrinsics (1): [0xff31…1516]] 2020-08-07 12:28:18 🔖 Pre-sealed block for proposal at 3. Hash now 0x878796e04d7bf0337921dd3b50c8cafec808202735859e3b92fc75d5df5c9ed6, previously 0xfdf55a8d3975da5a57e6ab7ba66c97d6ac26099af465ec6a58a9c2150438e1ec. 2020-08-07 12:28:18 ✨ Imported #3 (0x8787…9ed6) 2020-08-07 12:28:18 💤 Idle (1 peers), best: #3 (0x8787…9ed6), finalized #0 (0x5094…9695), ⬇ 0.7kiB/s ⬆ 0.7kiB/s 2020-08-07 12:28:23 💤 Idle (1 peers), best: #3 (0x8787…9ed6), finalized #1 (0xf0d7…f842), ⬇ 1.0kiB/s ⬆ 1.0kiB/s 2020-08-07 12:28:24 ✨ Imported #4 (0xdf76…3ebf)2.10 监控效果展示
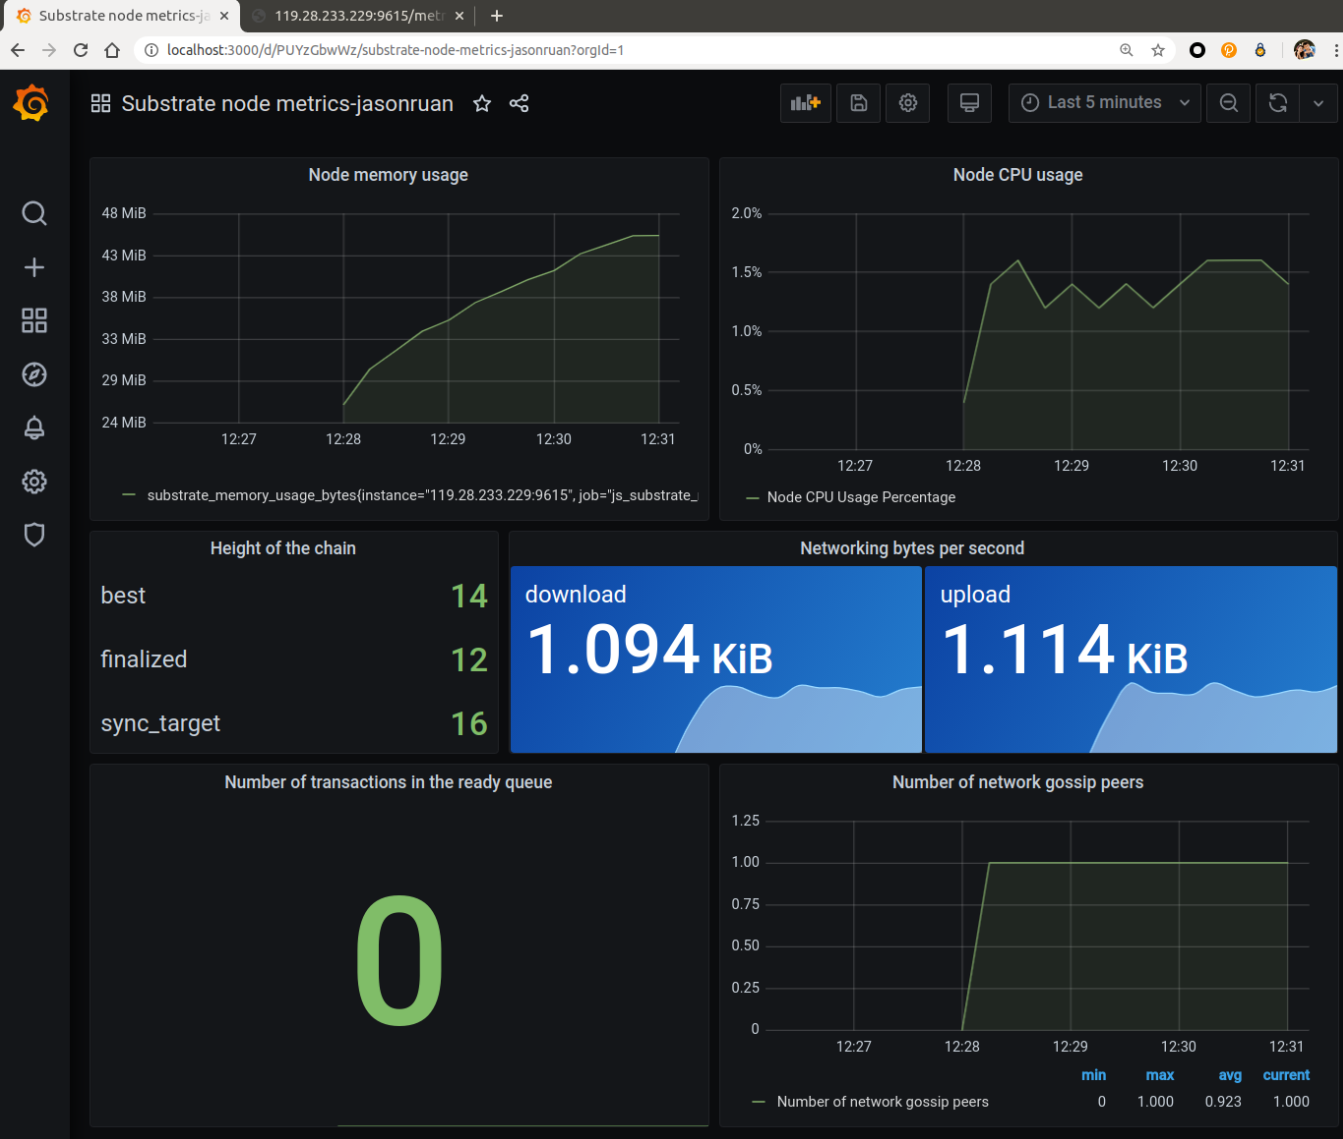
3 参考资料
https://substrate.dev/docs/en/tutorials/visualize-node-metrics/
声明:本站所有文章,如无特殊说明或标注,均为本站原创发布。任何个人或组织,在未征得本站同意时,禁止复制、盗用、采集、发布本站内容到任何网站、书籍等各类媒体平台。如若本站内容侵犯了原著者的合法权益,可联系我们进行处理。


